Sunday, June 30, 2024

GIS 5100 Introduction - About Me Story Map

Hello, everyone! My name is Marc Wright and I am currently in my third semester of the M.S. in GIS Administration program. Outside of school, I love to ride my motorcycle [2008 Harley Sportster 1200], spend time with my family, work out at the gym, read, draw, and work on the lawn / landscaping. My wife and I are also very active in our local church [Oklahoma City Community Church] and have recently committed to service opportunities that revolve around feeding the homeless within our community. Professionally, I work full time as a Network Designer / GIS Technician / Mapping Technician for a fiber optics company based out of Norman, Oklahoma. I am thankful that I get to utilize some of the knowledge that I am obtaining from the coursework here at UWF, but I am also very excited to make the jump into some sort of GIS Analyst position. Academically, I received my B.S. in Environmental Design through the College of Architecture at the University of Oklahoma, but ultimately decided against obtaining my Master's degree in Architecture. My goal upon completion of this program is to go where the best opportunity arises [I would love to find myself in the environmental sector, something like species or land conservation], and just go with the flow from there! There are not too many GIS jobs located in Oklahoma City currently, so moving out of state after graduation is probably a very realistic option.

Some adjectives that would describe me are tenacious, determined, optimistic, and comical [I think I am hilarious, but my three teenage step-daughters do not seem to agree]. Good luck to you all this semester, and I look forward to working with you!

Here is the link to my story map: Wright Family Travel Log but I have also embedded it into this blog post below [the formatting is a little off, due to the constraints of the blog frame].

Thursday, June 20, 2024

GIS 5103 Module 6 - Manipulating Geometries

For the final module of GIS Programming, we explored the many different ways to manipulate geometrical datasets using Python scripts. All datasets that we have worked with in this course have been vector data, or data that consists of points, lines, and polygons. At its core, these three data types are made up of either one vertex [point feature classes], or multiple vertices [line and polygon feature classes]. Something to note here, is that line feature classes can consist of one line segment [the distance between two geographical points, or vertices]; however, they can also be made up of many line segments, with each segment having two vertices. If the feature is a continuous line segment, the last vertex of one segment will match the first vertex of the next. When working with polygons, the coordinates of the first vector will match the coordinates of the last vector; this ensures that the polygon is, in fact, a closed, areal entity.

How can this geographical data be stored and manipulated by a Python script? In short form, a for loop can be used to extract all the desired information pertinent to each object within that specific feature class; this information is stored as an array. From this point, a nested for loop can be ran [using a specific geometry token] to retrieve geographical coordinates for each vertex that is responsible for making each feature. Once, this token has been used to extract the point data of each vertex, the data can be manipulated and used in other geoprocessing tasks.

For this assignment, we were asked to create a script that iterates through each object of a feature class, extracting all vertices that make up that object, number each vertex within the object, and also extract the name associated with said object [the feature class we were working with was named 'rivers']. Finally, we were to print the output to the screen and to a .TXT file so a comparison could be made to ensure the script was accomplishing the task at hand.

As shown in the flowchart below, all standard coding procedures were performed first, such as importing modules, setting the working environment, and setting any variables needed to run the program. Next, the script prints a message stating an empty .TXT file is being created; the file is then created, followed by a subsequent message that informs the user that it was created successfully.


Next, the script initiates a search cursor and enters a for loop that iterates through each feature included in the 'rivers' feature class. Once inside this first for loop, a counter begins that will number each vertex within the current feature. The code then enters a second for loop which will extract each vertex of the current object. Once the final vertex is reached, a blank line is printed to separate each of the features [for legibility purposes], and the code returns to the initial for loop progressing forward to the next feature in line, entering into the nested for loop once again. After the script has progressed through the entire 'rivers' feature class, a 'script completed' message is printed to the screen. Finally, the 'row' and 'cursor' variables are deleted, and the script closes the .TXT file. The results of the script can be seen below:

While the logistics of this script were fairly simple, it does instill some curiosity as to how advanced Python scripts can get in regard to geometrical manipulation of vector datasets. I am positive that this could be a career-long endeavor, with endless possibilities. As I have said in previous posts, I am eager to dive deeper into the capabilities of Python scripting.

Monday, June 17, 2024

GIS 5103 Module 5 - Exploring and Manipulating Data

GIS Programming, Module 5 allowed us to take the knowledge obtained throughout the four previous modules and apply them into realistic ArcGIS scenarios. There was a great deal of application, even more learning, and probably more trial-and-error than I would like to admit. This module forced us to dive deeper into Python scripting, gaining more confidence to work with dictionaries, SQL [Structured Query Language] queries, and Search Cursors. I will not admit to being a Python professional yet, but I am proud to say that I successfully applied this knowledge at work, creating four separate scripts that automate specific tasks, shaving off the total amount of time it takes to perform my job.

For this particular Module, our required script was to perform the following tasks: create a file geodatabase, copy feature classes into the newly created geodatabase, perform a Search Cursor on the feature class named 'cities' [finding all county seats in the state of New Mexico], using a Search Cursor to create a list of all these queried county seats, their classification, and their population [as of the 2000 census]. Finally, the script was to extract the names and the populations of each county seat and insert them into a blank dictionary that was created. 

As shown in the flowchart below, this is the most complex script that has been created in this class, performing numerous functions throughout its execution. Following along the path of the flowchart, the script begins by importing the ArcPy module and setting the current working environment. After this has been accomplished and a few variables have been set, the file geodatabase was created in the S:\GISProgramming\Module5\Results\ folder. Next, the script iterates through a loop, copying each feature class from the data folder into the geodatabase.


After the geodatabase has been created, a Search Cursor was run on the 'cities' feature class, looking for all cities whose feature attribute equaled 'County Seat'. It is worth mentioning here, that there are three different types of Cursor functions that can be executed through scripts in ArcGIS: Search, Update, and Insert. Search Cursors are used to search out records with no ability to write over the existing attributes. Update Cursors are used to change / overwrite existing attributes of feature classes. And Insert Cursors are used to insert new rows into the attribute table, essentially creating new features within that particular feature class. 

The first time I worked through this code, it was a cut and paste job from the exercise and the code worked fine. However, our text states that arcpy.SearchCursor() is only included with ArcGIS for backwards compatibility purposes, and that the newly adopted arcpy.da.SearchCursor() function was highly recommended moving forward. [Zandbergen, 2020. p. 248] While the functions themselves are similar, I experienced quite a few errors while trying to integrate the SQL query into the parameters of the arcpy.da.SearchCursor() function. Multiple online searches, in addition to the textbook, provided ample support to work through the issues that occurred during this overhaul. 

Lastly, the script creates an empty dictionary and populates the keys of the dictionary with the county seat's name and populates the value of the key with the 2020 census population count. There were no major issues in this part of the script, but I would recommend keeping one thing in mind. Cursors only move in a forward position, so if the script iterates through a For loop, the cursor needs to be returned back to the beginning row of the attribute table, especially if the data is going to be searched subsequently. There are a couple methods to remedy this situation, and neither are complicated; this is just a point worth mentioning. The results of the script can be viewed in the screenshots below.


Ultimately, this Module provided the most realistic applications in Python scripting for ArcGIS, and I am ecstatic that I was apply this knowledge to create scripts that automate redundant tasks at work. Even after this class concludes, I will continue to develop more Python scripts that enable me to be more productive and efficient at my career.

Source:
     Zandbergen, P.A. (2020). Python Scripting for ArcGIS Pro. Esri Press.

Monday, June 10, 2024

GIS 5103 Module 4 - Geoprocessing with ModelBuilder and Python

Module 4 of GIS Programming was another opportunity to dive deeper into the Python programming language and its many applications in Geographic Information Systems spatial data analysis.  The first part of the exercise was utilizing the ModelBuilder tool that is included in the ArcGIS software platform. Previously, I had no experience with this tool, but immediately realized its potential in the automation of GIS data processing. Below is an example of what the tool looks like [I used files from work not related to our assignment to avoid giving the assignment's answer away to other students.] As seen below, the model looks like a flowchart where the blue input elements are used as parameters to run the intersect tool [tool elements are yellow in ModelBuilder], and the output of the intersect tool is a new feature class shown as a green element. In this particular case, the Poles_Intersect feature class will contain all points from the IEC AUXILLARY POLES feature class that lie within the zone feature class's boundary. This can all be achieved by simply clicking the 'Run' button after the model is built. The model built for the weekly assignment was to use the clip tool to single out soil areas that lie within a polygonal feature class named 'basin'. Once this was accomplished, we were to select out and delete areas that were categorized 'Not Prime Farmland'. Essentially, this provided areas within the basin that were suitable for farming. 

These are very simple examples of ModelBuilder models, but more complex models can be viewed by a simple Google search. Another great feature of ModelBuilder is the option to export the model directly to a Python script file. This can be very helpful when the complexity of the model exceeds the Python knowledge base of the user. A model can be built, validated, and exported to a script file; the resulting code can be examined by the user to discover how to reach the same result by utilizing the Python programming language.


The second half of the assignment was to create a Python script [from scratch] that executes three ArcGIS geoprocessing tools.  The flowchart of this script is very linear, as shown below:


As the flowchart illustrates, the script takes a feature class named hospitals, adds geographic x- and y- coordinates to each point of the feature class [the coordinates will be added to the attribute table, in fields that are created by the Add XY Data tool]. Next, the script will create a buffer around each point [hospital] that has a 1000-meter radius. Finally, the dissolve tool was run on the newly created buffers to merge them all into a singular, polygonal feature class. Printed messages were created to inform the user what process was being ran, and the ArcGIS GetMessage() function was added to show statistics related to each of the three functions ran. The results of the script can be shown below.

 
After the script was ran, the results were examined in the ArcGIS interface. As shown below, each point represents a hospital, that lies within the buffer feature class, which has been dissolved together into a singular, continuous polygonal area. Also, the X- and Y-coordinates can be seen in the two furthest right-side columns of the attribute table.


Once again, this exercise was a great opportunity to learn more about Python scripting and the automation of geoprocessing workflow. I did not encounter any major problems working through this exercise, other than a few punctuation errors that were easily fixed. Other than these minor issues, the whole process was seamless. Although there are only two modules left in this class, I am truly excited to apply this knowledge at work to see how many redundant processes I can automate utilizing ModelBuilder and / or Python scripts.

Monday, June 3, 2024

GIS 5103 Module 3 - Python Debugging


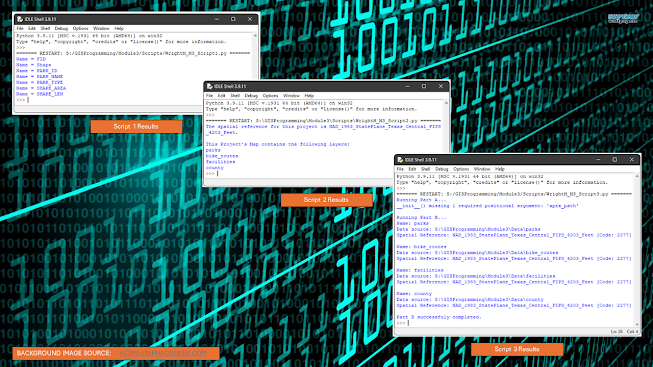
Python scripting is a language of its own, and not using the proper spelling, spacing, and punctuation can make it impossible for the computer to execute the code, exactly like the same mistakes in any written language can render interpretation impossible to a human reader. The goal of Module 3 of GIS Programming was to debug errors in codes that were provided to us, and ultimately enable the computer to successfully interpret the scripts. The assignment was broken down into three parts, with a separate script for each, and the results of each can be referenced in the top image shown above. 

The first was a simple script that was written to type out the fields of an attribute table of a specific feature class. All errors were syntax errors, which include spelling, punctuation, and indentation mistakes. Working through errors one at a time is definitely the most efficient route to debugging any script; I learned this the hard way. When I had initially opened the file, I zealously jumped into the debugging process, changing this error and that error without running the code. In the midst of this haphazard methodology, I managed to change something in the code that did not need to be changed, and I was unable to successfully debug the code. After recopying the original script, I ran the code, fixed the given error, ran the code, fixed the new error, and repeated this process until the script ran. This took approximately three minutes compared to the ten minutes that were wasted by my initial technique. As shown in the top picture, the output was a list of all the fields included in this particular feature class's attribute table.

The second part of this assignment was very similar to the first part; I used the same method of running the code, fixing the error, and repeating until the script ran. This process was also very quick, and probably took less that ten minutes total. As shown in the top picture, the output was a message stating the Projected Coordinate System of the ArcGIS project and a list of all layers that were contained in the project.

Finally, we were tasked with handling a totally different type of error: a run-time error [also called an exception]. While a syntax error will prevent the code from running at all, an exception will allow the code to run, but produces an error that prevents the code from running successfully. In this scenario, we were provided a script that was broken down into two parts; the first section of code contained an error that prevented the second part from running. Instead of correcting the error in the script [a missing parameter that is required by the mapping function], we were required to get the code to run, producing an error message for the first part of the script and successfully running the second part; to accomplish this, we learned how to employ try / except statements. As shown in the bottom image, the flowchart can be followed to see how the script functions. First, the script begins, and the arcpy module is imported [this allows Python to interact with ArcGIS]. Next, a try statement is added to see if the portion of the code declaring variables contains an error. If it does throw an exception, an error message is produced, and the program continues on to the second half of the script. If no exception were to occur, the script would cycle through the entire lyrlist of the project, searching for a feature class named "parks". If a feature class is named "parks", the layer name is printed, the layer's visibility is turned on, and the layer's labeling is also made visible. Finally, the project is saved, the variables declared in the script are deleted, and the second half of the script is executed. If no feature class is named "parks", the script jumps to the lines commanding the project to be saved and the variables to be deleted, and then the interpreter proceeds to the second half of the code. The results of this script can be viewed in the top picture. 

This assignment was a great opportunity to dive deeper into the commands and functions of this programming language, and to familiarize ourselves with the particular syntax that must be used while writing Python scripts. I am still no where near a Python guru, but I am happy with the knowledge I am obtaining through this class on a weekly basis. 

GIS 6005 Module 1 - Map Design and Typography

Module One of GIS 6005 - Communicating GIS revolved around cartographic design principles and typographical principles that should be follow...