Showing posts with label GIS 5050-Intro to GIS. Show all posts

Thursday, October 12, 2023

GIS 5050 - Final Project


For the Final Project of this course, we performed a Geospatial analysis of the proposed location of the Bobwhite-Manatee Transmission Line; this included analyzing its effect on environmentally sensitive lands in the area, the number of homes affected by the transmission line, and the number of schools in proximity to the transmission line. Finally, we attempted to calculate the length and the cost of this 230-volt electrical line that spans between two counties in western Florida [Manatee and Sarasota County]. The scope of this project was very extensive, covering almost all skillsets we have learned throughout the past eight weeks. 

I was happy with the outcome of ArcGIS Story Map [embedded above], but not entirely happy with my video presentation of this slideshow. I pondered re-doing the entire presentation, but then I gave myself a little grace and decided that I am my own worst critic and that I would probably critique the second rendition worse than the first. Overall, this was a great introduction to the science of Geographic Information Systems and a great opportunity to put my knowledge to the test. I enjoyed this project thoroughly and I hope you find it interesting as well. The video presentation [and transcript of the presentation] can be viewed at the following link:


The ArcGIS Story Map can also be view without the presentation at the following link:

Tuesday, October 3, 2023

GIS 5050 Module 6 - 3D Scenic Map

The second portion of this lab assignment was to take a LIDAR dataset and convert it into a DEM [Digital Elevation Model]. This workflow is essentially creating a 3D terrain from information obtained from LIDAR equipment and importing it into ArcGIS Pro. Once this was accomplished, we were able to take the raster images and layers created in the Georeferencing portion of the lab and put them on this digital terrain. The map above was created using the DEM [as opposed to the digital terrains that come in ArcGIS Pro. I chose to use this because the topology of the land looked more accurate than the standard 3D basemap. This portion of the lab slowed my computer down immensely, so I had to be very intentional on the changes I made to the view / layout. I am extremely happy with the final product of this map. The aerial images overlaid very nicely on the DEM, and the orange / red colors used on the buildings / roads provides a nice contrast that draws the viewers eyes straight to the 3D terrain. This portion of the lab was very interesting, but working on this through a virtual desktop was a little frustrating at times [I believe ArcGIS spontaneously shut down four times].
 

GIS 5050 Module 6 - Georeferencing


 This week's lab assignment was based on Georeferencing. Georeferencing is basically taking an aerial [or raster] image and overlaying it on a basemap in ArcGIS. Once the image has been imported, points on the image can be selected and then matched up with control points on the basemap; this gives the aerial image coordinates where it lies on the Earth. No image is going to be perfect, so this lab assignment focused on Root Mean Square error which is a value that measures the distance between predicted calculated values and the actual, measured value. Generally speaking, the lower the RMSE the better. This is not always true [especially on images that have higher distortion levels], as was the case in the southern image. On this image, 2nd and 3rd Order Polynomial Transformations were used; these transformations bend / warp the image to fit the control points set in the Georeferencing process. During this process, a sacrifice was made on the RMSE value in order to get a more accurate image. After the Georeferencing process was complete, we then created features and added them to existing feature classes. In this case, I made a personal decision to export them to their own feature class so I could make them a different colors and label only those specific objects. Lastly, we created a multiple ring buffer around a Bald Eagle's nest that is located in proximity to the UWF campus. 

The final product of this lab is a map of the University of West Florida campus with three raster images Georeferenced and overlayed on the basemap. The buildings and roads [orange] were used as control points to get the best fit possible. The map also includes the UWF Gym and a portion of Campus Ln [which did not exist at the creation of the shapefiles] and the location of the Bald Eagle's nest with a 330ft and 660ft buffer ring encircling it. I chose this particular basemap because I felt that it provided much contrast against the raster images, but did not clash with the color scheme either. I went with an orange color as a warning of being within 660ft of the eagle's nest, and a red color as a warning of being within 330ft. I used these colors again for the buildings and roads to tie them into a common color scheme, and I used a bright purple color to make the digitized Gym and road [Campus Ln] to really stand out on the map. Overall, I am happy with the quality of the map, and I did not encounter any issues that prolonged the duration of this lab assignment.

Monday, September 25, 2023

GIS 5050 Module 5 - Geocoding

This week's lab assignment allowed us to work with .csv [comma separated values] files and import them into ArcGIS. The process was essentially taking a spreadsheet [non-graphical data] and importing it into ArcGIS, which superimposes the data onto a map [making it graphical data]. The dataset we used during the first portion of the lab utilized latitude and longitude coordinates to direct ArcGIS where to put the points on the map. 

The second part of this lab was taking non-graphical data that used street addresses instead of coordinates [latitude / longitude], applying an address locator to our map, and geocoding the dataset. This essentially went through every entry in our spreadsheet and mapped it out by looking the address up in the address locator that we applied earlier in the process. The end result was a web map that locates all schools within Manatee County, Florida [see above]. Out of personal preference, I pasted an exported map above, but this map can be viewed by clicking the link below [this link is public: it does not require the user to have an ArcGIS account]:

https://pns.maps.arcgis.com/apps/mapviewer/index.html?webmap=491be172f73f494fa1dd0ada7bbb1941


Wednesday, September 20, 2023

GIS 5050 Module 4: Vector Analysis

In this week's lab assignment, we worked on the manipulation of vector data. The first part dealt with creating geodatabases, storing feature classes within these geodatabases, and then using commands to select certain features according to their attributes. This portion of the assignment was very straightforward and the least time-consuming of the two.

In the second half of the lab, we continued learning about the manipulation of vector data using an array of functions, scripts, and tools that are located within the ArcGIS Toolbox. This part of the assignment gave us the opportunity to explore some of these tools on our own and create a map [shown above] with only a few given requirements. I did not have many problems with this lab; a majority of my time was spent on exploring the tools available and the numerous options associated with each.

The map above is a graphical representation of possible campsites that meet certain criteria at De Soto National Forest in Perry County, MS. The possible campsites were then color-coded by their size in Hectares. The locations of these campsites are based on distances from roads [using a fixed distance buffer of 300 meters], distances from lakes and rivers [using a variable distance buffer of 150 meters from lakes and 500 meters from rivers], and then the remaining areas that fell within the confines of conservation areas were subtracted from the possible campsite areas. As far as aesthetics are concerned, I chose a landscape orientation due to the fact that our main map frame is relatively square shaped, and I chose a dark red for the roads and shades of green for camp sites because these are standard colors used for these types of features, according to cartographic standards. Lastly, I chose to divide my campsites into four equal-interval divisions. These are some of the more important considerations I gave that led to this map's final appearance. Overall, I am completely satisfied with this lab assignment and the map that was produced as I worked through it.


Wednesday, September 13, 2023

GIS 5050 Module 3: Map Projections


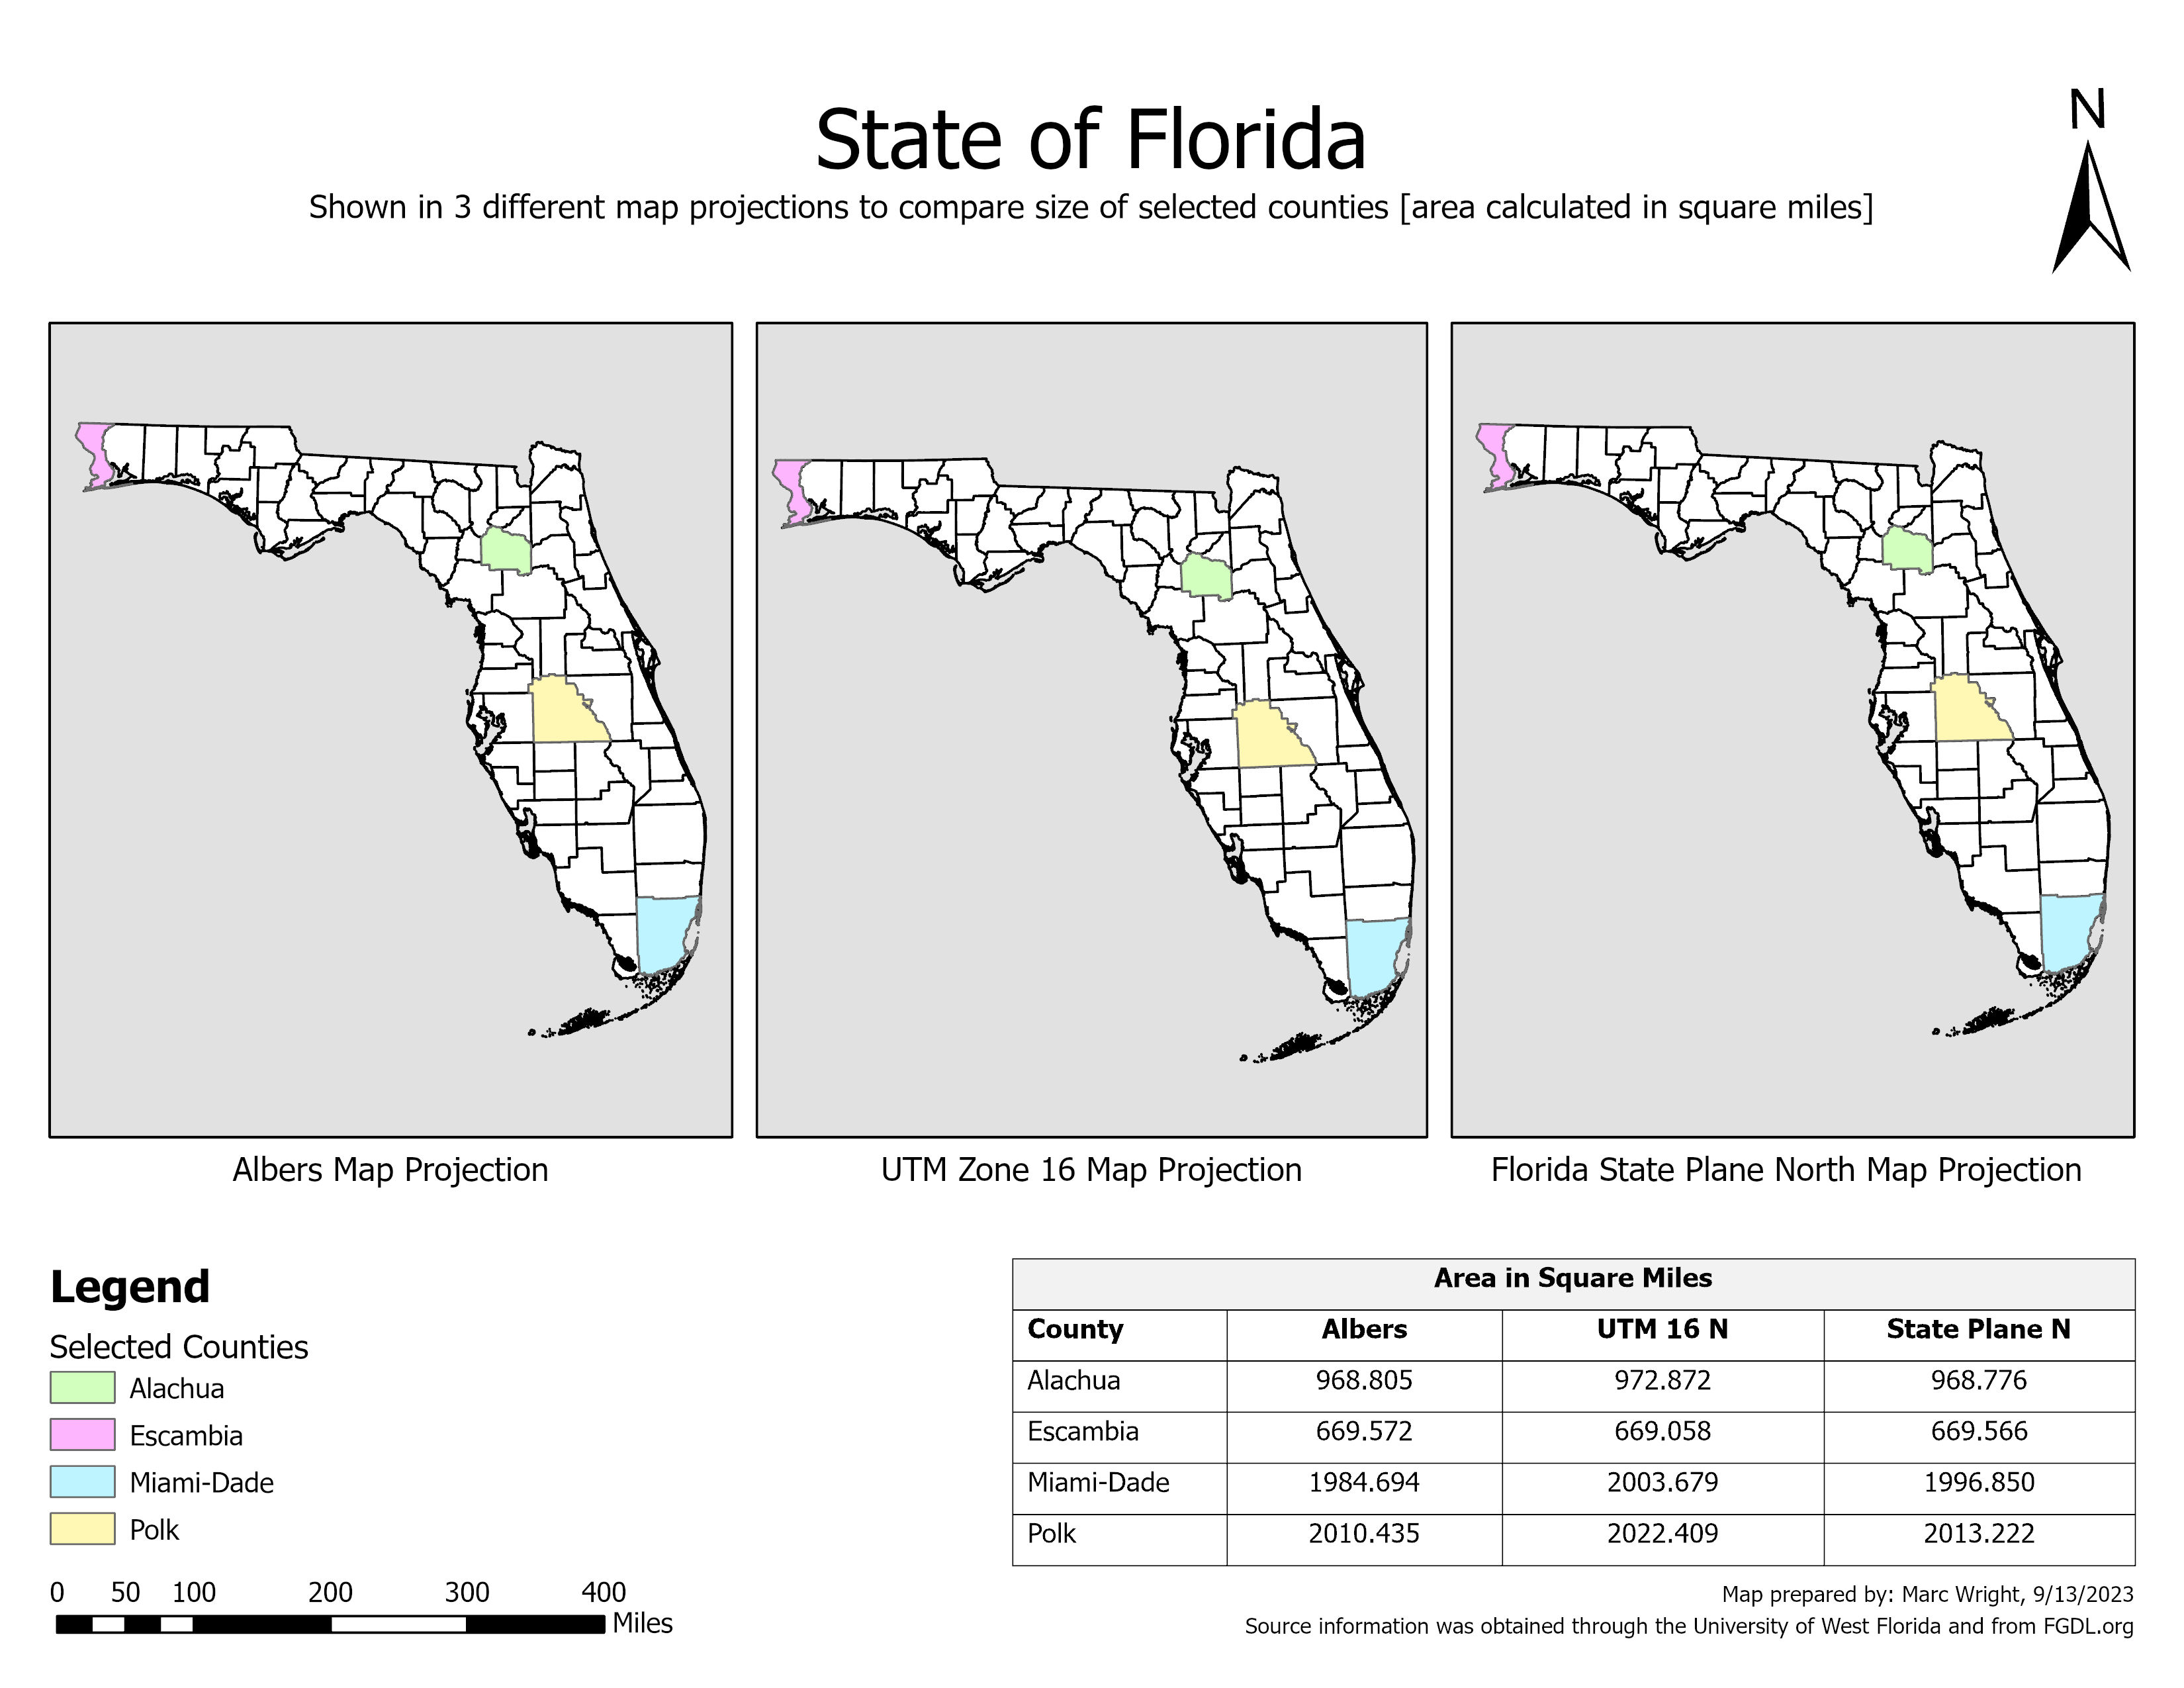
On the second part of this week's lab assignment, we took a shapefile of all the counties located in the state of Florida and projected them with three different map projections [Albers, UTM Zone 16N, and Florida State Plane]. From this point, we calculated the different areas of four selected counties [in square miles] and compared the difference between each of the map projections. We then composed all the information on a map so it can be visually interpreted at a glance. Finally, we took raster images and defined a projection onto them, so they could be accurately placed on a map. This lab assignment was interesting, but it seems as if map projections are a subject that could be expanded on infinitely. I did not have any trouble following the steps in the lab assignment, so it seems that I spent the most amount of time compiling all the information into the map shown above and formatting it to an acceptable aesthetic level.
 

Monday, September 11, 2023

GIS 5050 Module 3 - Data Collection


This week's lab assignment was going out and collecting data of our choice and producing a map package, an online map, and [2] .KMZ files for Google Earth. As far as the software was concerned, the online portion of this assignment was the most confusing for me but I felt I had a decent grasp on it by the end of the day. We used the ArcGIS Field Maps app for collecting data out in the field and it was a surprisingly easy interface to navigate. As far as the data collection itself was concerned, I probably should have stuck with the suggested fire hydrants or stop signs. My subject of interest was survey monuments that have been registered by the Public Works department of Oklahoma City and these were not the easiest things to find. After a couple of failed attempts in some pretty questionable areas of the city, my son and I migrated our "scavenger hunt" to the outskirts of town and had considerably better luck. I have posted a screenshot of the ArcGIS Online map above [for those who do not have access to the program], and the link to the map is listed below:


Wednesday, September 6, 2023

GIS 5050 Module 2: Cartography


 This week's lab assignment was considerably longer than the first module, but it was an excellent opportunity to dive deeper into some of the abilities of ArcGIS. The objective was to create a map of Escambia County, FL that shows exactly where the University of West Florida is located. The map was also to provide reference using landmarks, such as cities, rivers, and interstates. It was also to include an inset map of the state of Florida that marked where Escambia County is located within the state. We learned many new features, such as clipping a shapefile to the boundaries of another shapefile [notice how the interstates and rivers stop at the border of Escambia County, FL], adjusting the scale of the maps, and specifically customizing the focus of a map frame to a particular layer's extent. Also, there were numerous map elements that were introduced [i.e. legend, scale bars, north arrows] and we were given the chance to explore their various settings to create a map that was individualized to our own personal artistic styles. Lastly, we explored each shapefiles' meta data which lists all sorts of information relevant to who collected the information, when the information was collected, and how the information has been revised and stored over the years. The files are very exhaustive in nature and will take some experience learning how to navigate through them, considering the amount of information that is included in them. Overall, I am pleased with the amount of learning that was involved in this cartography lab and I am very pleased with the aesthetic quality of the UWF Campus Location Map that was created during this assignment.

Monday, August 28, 2023

GIS 5050 - Module 1 Lab


This week's lab assignment was very straightforward. We were introduced to the ArcGIS interface, how to navigate through the program, how to add data to the basemap and change its symbology [appearance], and, lastly, how to set up a basic layout and export it to a .JPEG file. I execute these basic operations on a weekly basis at work, so this lab assignment confirmed that Google correctly taught me the most efficient way to accomplish these tasks. Next week's lab will probably breach my scope of knowledge regarding ArcGIS and what it is capable of, but this was an excellent learning opportunity!

GIS 6105 Module 6 - Interpolation

For the final map deliverable, I simply modified the map from Module 5 to create a sense of continuity between the two sequential lab assign...